
Data visualization of self-portrait
PORTRAITS - Saturation (Median) vs. Hue (Median)
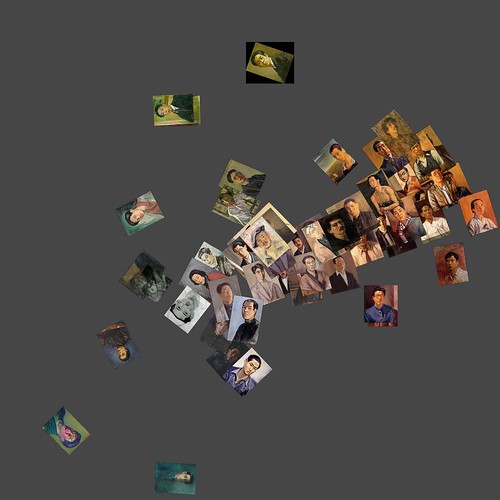
X axis: Saturation (Median)
Y axis: Hue (Median)
Program used: ImageJ (ImagePlot)
This graph visualizes all of the portraits in one graph, identifying saturation on the x-axis and hue on the y-axis. These portraits are work of several professors and student's at Tokyo School of Fine Arts from 1910s to 1930s.